Been busy these past few days..
Well, this post is about taking advantage of the built in data store that started in 10gR1.. yeah it’s AWR, and it’s very much like a “Statspack on steroids” (got that from Kyle Hailey’s modules). What’s exciting about 10g and above is we could utilize the “Time Model” and the OSSTAT view and use them together with the SYSTAT view to have a far better workload information when going through all the SNAP_IDs.
I have this “little” issue before of getting lazy when generating multiple AWR reports… yeah it’s just so daunting, you’ll get tired just by generating those reports by hand and the catch is… you’ve not yet analyzed anything yet.. :p (but yeah, you’re lucky if you’ve got access to the OEM performance page)
So.. I was thinking, if I get to see all the relevant workload info across SNAP_IDs it would be easier for me to notice trends and even possible for me to visualize the data, or even possible to do some statistics out of it.
On the Chapter 9 of Craig Shallahamer’s book (Oracle Performance Firefighting)… there he explained in detail what information you need to get for you to be able to define the Database Server’s Capacity, Requirements, and Utilization (U=R/C)…
I’ve outline some of the points here (see the Firefighting tab)
…. since the AWR report is based on DBA_HIST tables, I was able to make a script that shows the following:
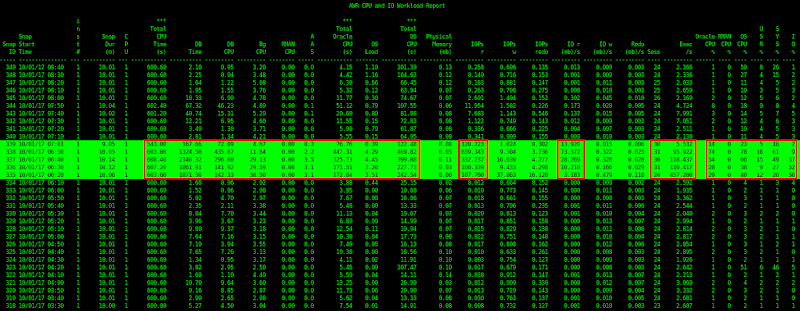
1) CPU capacity – see image below, column 4 to 6
2) CPU requirements – see image below, column 7 to 14
3) Memory requirements – see image below, column 15
4) IO requirements – see image below, column 16 to 21
5) some SYSSTAT delta values – see image 22 to 23
6) Utilization – see image below, the last 6 columns
…. I’ve used the tables below for the query:
- dba_hist_snapshot
- dba_hist_osstat
- dba_hist_sys_time_model
- dba_hist_sysstat
Check out the scripts here:
For Linux/Unix: awr_genwl.sql
For Windows: awr_genwl_win.sql
IMPORTANT NOTE: Diagnostic Pack License is needed for the scripts, I’m updating my scripts frequently.. if the download link is not working here.. check out the Scripts Section for the file name and the most recent version of the script
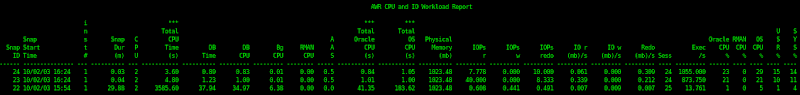
Now time for some action! ![]()
As you can see from above.. there is a highlighted portion (in green). By running the script, we have identified that there was a sudden spike on the following:
- “DB Time” (7th column).. which means there is some significant user level activity going on!
- IOPs read (16th column) and IO read MB/s (19th column).. which means that the stresser is possibly more on SELECT operations
- Oracle and OS CPU% utilization (last 6 columns)… which means the spike on activity is attributed by Oracle and not other operations on the OS, also you could see that it is not attributed by an RMAN activity (because it’s zero!)
- Plus the Average Active Sessions (AAS) (11th column) and the OS Load (13th column) increased… which correlates to the high CPU%
The sudden spike happened around 6:20 to 7:01 (SNAP_ID 335-339)
If you are a fan of AAS (Average Active Sessions) see below how I was able to derive the value (example for SNAP_ID 335):
AAS = DB Time/Elapsed Time
= (1871.36/60)/10.06
= 3.100331345
BTW, I only have 1 CPU (see column 5)…
So you have a lot of info (facts, numbers, figures) to justify the drill down on specific SNAP_IDs or time frame. From here you could either use ASH, run the AWR report, run ADDM, or use OEM. The good thing here is, you are not guessing! and you’ve done some quick correlation on the OS and the database before drilling down further…
Now…
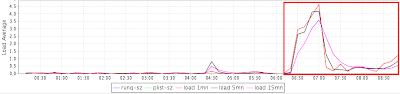
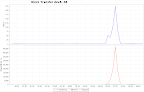
Let’s see if we could correlate the output of the script with the SAR data.. from the image below, you can see that the spike on load happened around 6:20 and ended around 7:30. And yes, attributed by wait on IO (see the red color).
BTW, I’m using kSar for visualizing the SAR data.
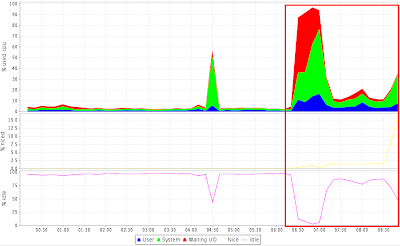
Also you’ll see the Load Average, which is the same from the output of the AWR script above.
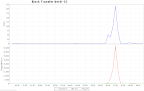
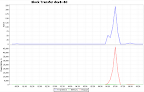
Now, let’s check out the IO devices… the database is using ASM with 3 ASM disks, I would get the major and minor numbers and correlate these with the SAR data…
GROUP_NUMBER NAME		  HEADER_STATU MOUNT_S STATE	  TOTAL_MB    FREE_MB LABEL		   PATH 		REDUNDANCY
------------ -------------------- ------------ ------- -------- ---------- ---------- -------------------- -------------------- --------------------
	   1 DATA_1_0000	  UNKNOWN      OPENED  NORMAL	      3067	    0			   /dev/sdc1		UNKNOWN
	   1 DATA_1_0001	  UNKNOWN      OPENED  NORMAL	      3067	    0			   /dev/sdd1		UNKNOWN
	   1 DATA_1_0002	  UNKNOWN      OPENED  NORMAL	      3067	    0			   /dev/sdf1		UNKNOWN

[oracle@dbrocaix01 osm]$ ls -l /dev/sd[c,d,f]
brw-rw----  1 root disk 8, 32 Jan 17  2010 /dev/sdc
brw-rw----  1 root disk 8, 48 Jan 17  2010 /dev/sdd
brw-rw----  1 root disk 8, 80 Jan 17  2010 /dev/sdf
You can see from the images of the block devices below that they are mainly on Read Activity.. which
validates the output of IOPs read (16th column) and IO read MB/s (19th column) of the AWR script… cool!
 |
|
 |
|
 |
Another thing… When you get to run the script on your environment also try to generate AWR report on particular SNAP_IDs… you’ll notice that the values you got from the query will be the same on the AWR report…
Update (20100201):
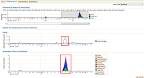
… I’d like you to see the output of the Enterprise Manager Performance Page on the time when the sudden workload spike happened.
 |
|
 |
|
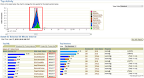 |
The first and second images above came from the root page, you’ll see the following similarities on the AWR script output:
- Load Average, which is on the range of 3.2 to 4.4
- Average Active Sessions (AAS), which is on the range of 2.2 to 3.5
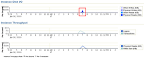
- Disk IO read MB/s… see that the graph is reaching the 80000 Physical Reads KB/s.. check the SNAP_ID 338 (Time – 6:50) from the AWR script output you’ll see that it generated 73.372 MB/s! Also, see the output of the ADDM run below… which further validates the output of the script:
FINDING 2: 18% impact (236 seconds)
-----------------------------------
The throughput of the I/O subsystem was significantly lower than expected.

   RECOMMENDATION 1: Host Configuration, 18% benefit (236 seconds)
      ACTION: Consider increasing the throughput of the I/O subsystem.
         Oracle's recommended solution is to stripe all data file using the
         SAME methodology. You might also need to increase the number of disks
         for better performance. Alternatively, consider using Oracle's
         Automatic Storage Management solution.
      RATIONALE: During the analysis period, the average data files' I/O
         throughput was 74 M per second for reads and 102 K per second for
         writes. The average response time for single block reads was 13
         milliseconds.

   SYMPTOMS THAT LED TO THE FINDING:
      SYMPTOM: Wait class "User I/O" was consuming significant database time.
               (37% impact [488 seconds])
|
The third image is the Top Activity section… you can see that most of the activity are SELECTs and the database is waiting on User and System I/O… (see the Top SQLs and Top Sessions)
BTW, this script could also be used on a RAC environment… you have to run it on each node. I’ve made it pull the DBID and instance_number automatically..
Update (20100202):
On Windows environment for the DBA_HIST_OSSTAT view it does not contain the LOAD and IOWAIT_TIME stat_name so I removed these columns from the query. See the sample output below:
That’s all for this post! Now you’ll know better about the workload of your environment ![]()

